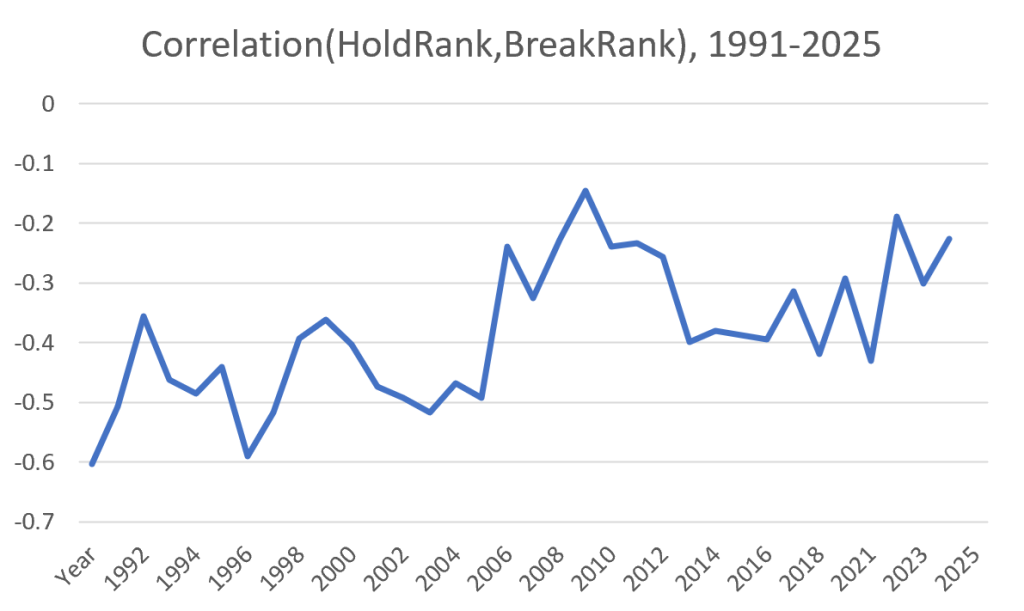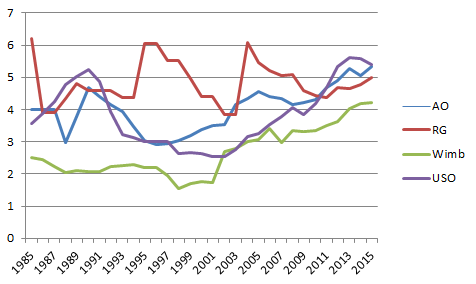
I wrote last week about the decline of specialization on the men’s tour. I proposed that we see more good all-around players because, as the overall level improves, there’s less relative value in being a one-dimensional servebot or dirtball grinder. A few people responded–and I paraphrase, slightly: It’s the surfaces, stupid. Everybody seems to agree that at some point, let’s say between peak Sampras and peak Djokovic, surface speeds converged. Hard courts got slower, and some grass courts got slower, too. Serve-and-volleying mostly disappeared, and grinding baseline play took over. The only debate, it seems, is why. Was it a conspiracy to give the fans (well, all the fans except for the ones complaining) what they wanted? Is it the balls? The rackets? The strings? I’ve always been skeptical of the conspiracy theory. More generally, I have been–and still am–skeptical that playing conditions have changed that much. Just because everybody believes something–even if those people are top-ranked players and well-respected pundits–doesn’t make it true. The historical record shows that styles have changed, but it’s much harder to marshal evidence that the surfaces themselves are meaningfully different than they were 20 or 30 years ago. A quick review I’ve looked at this stuff before. Here’s a quick summary: The Mirage of Surface Speed Convergence (2013): I compared ace rates and break rates on hard and clay courts for pairs of players, 1991-2012. I found that the difference between hard courts and clay courts had, if anything, slightly widened, even though the conventional wisdom of convergence was fully in place by then. The Grass is Slowing: Another Look at Surface Speed Convergence (2016): I wish I had named this differently, because I didn’t show that the grass slowed , I showed that rally lengths at Wimbledon (and to some extent at the hard-court slams) were converging with those at Roland Garros. It was my first stab at the problem using Match Charting Project data, which meant it used rally length, instead of ace and break rates. However, it relied on limited data, which meant there were heavy biases in which players it measured. Surface Speed Convergence Revisited (2023): With more MCP data, I worked out a simple model of how much surface affected rally length, and how the effect had changed over time. Now without the selection bias, I showed that in both men’s and women’s tennis, the influence of surface on rally length had shrunk. Pick your stat To grossly oversimplify: If you look at ace rate, there’s no evidence of surface convergence. If you look at rally length, there is. I didn’t want to rely on a 2013 mini-study for the ace-rate conclusion, so I came up with some new fodder. My surface-speed ratings are based entirely on ace rate. Originally, this is because we don’t have better stats going very far back, while we do have ace rate for all ATP matches since 1991. The MCP has an increasing amount of coverage, but it is not complete, and the ace-based ratings have always seemed to capture surface-speed differences pretty well. There’s some noise, because there are only so many matches per tournament per year. But in general, they give us a pretty good idea of what’s going on. The downside is that they are indexed to each year’s average. The rating for the 1991 edition of Wimbledon is 1.20, meaning that–controlling for the mix of players–there were 20% more aces than a 1991-average event. This year, Wimbledon’s rating was 1.12: 12% more aces than the 2025 average. But are those averages the same? That question offers us a neat little experiment. Instead of indexing on a single-year average, why not do two years at a time? The pool of players was almost identical in 1992 as in 1991, so it’s a fair comparison. As it turns out, Wimbledon’s ace-based surface rating went down from 1.20 to 1.06 between 1991 and 1992. That kind of shift often happens due to randomness, but maybe it could be validated by a longer trend. Looking at two years at a time–1991 and 1992 together, 1992 and 1993 together, up to 2024 and 2025 together–allows us to make the same comparisons for the entire tour calendar, for a span of 35 years. Well, in that span, ace rate has gone up quite a bit. And not just because mediocre servers have been replaced by better ones. On average, the same servers (against the same returners, though the returner effect is much smaller) have upped their ace rate about 2% every year. Not enough to notice as it happens, but enough to move the ATP tour average ace rate from below 7% in 1991 to a bit over 10% today. Some of the difference is due to the tournament mix–a shorter clay calendar, mostly. But I ran the same analysis on a core group of 15 events that have been in the same place since 1991, and the controlled-for-play